> For the complete documentation index, see [llms.txt](https://docs.helpyousponsor.com/guides/llms.txt). Markdown versions of documentation pages are available by appending `.md` to page URLs; this page is available as [Markdown](https://docs.helpyousponsor.com/guides/advanced-features/reporting-and-analytics.md).

# Reporting and Analytics

HelpYouSponsor's Reporting and Analytics suite gives you complete visibility into your organization's donors, gifts, programs, and operational activity.

* **Reports** — build custom data views with the columns, filters, and schedule you need. Run, export, and pin report metrics to the dashboard.
* **Activity Log** — review every action taken on the platform, from sponsor signups to payment failures.
* **Dashboard Analytics** — see donation and sponsorship trends at a glance.

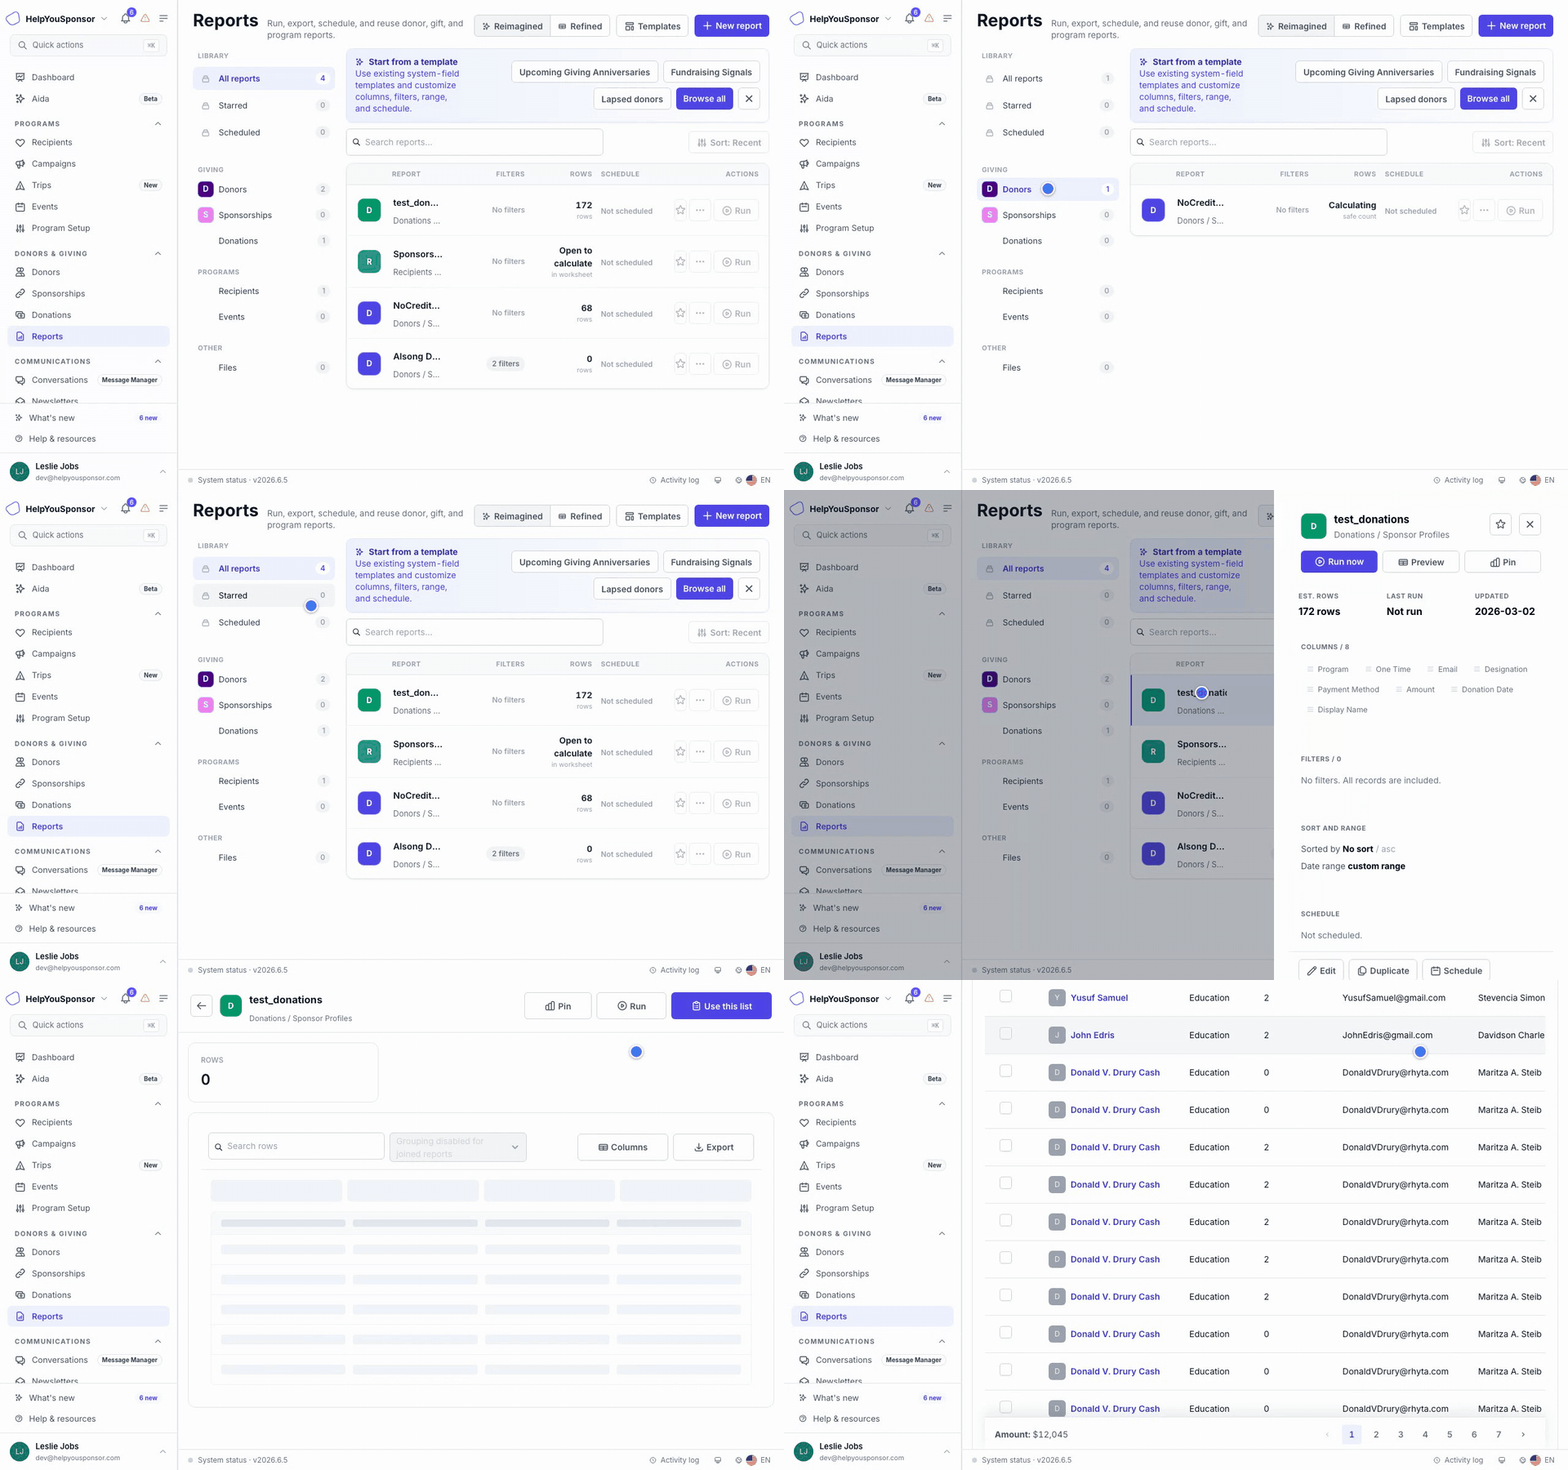
<figure><img src="/files/g6uy2E82nB9SolDGx1JQ" alt="Animated walkthrough of the Reports library"><figcaption><p>Walkthrough: the Reports library, a report's detail panel, and the worksheet preview.</p></figcaption></figure>

***

## Reports

Use **Reports** when you need a repeatable, filterable view of your data — donors, donations, sponsorships, recipients, campaigns, events, and trips.

### Reports Library

Open **Reports** from the sidebar under Donors & Giving.

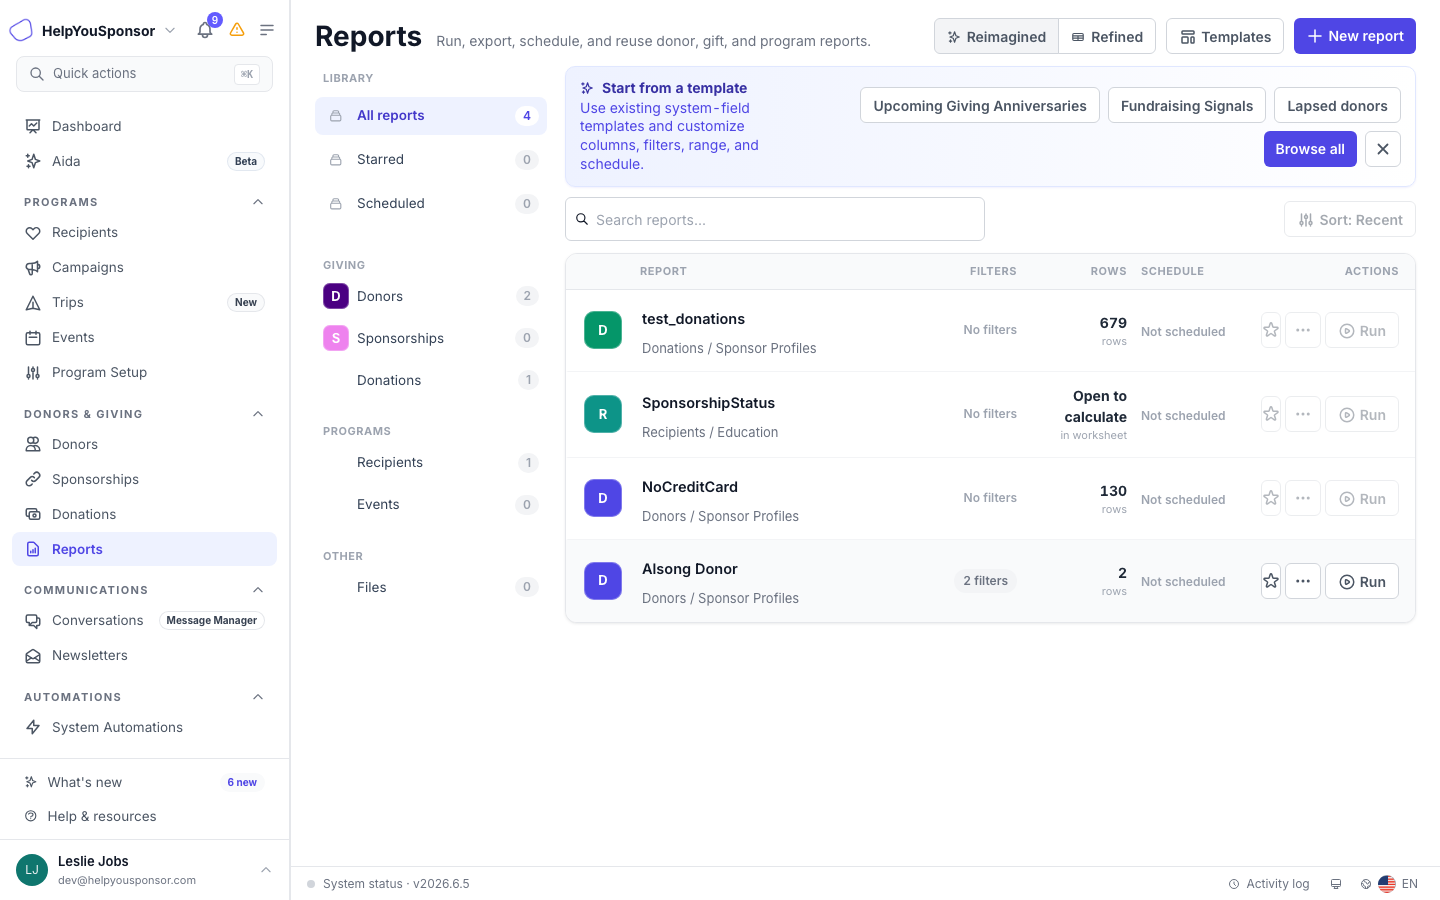
<figure><img src="/files/hD1goYcy9CCtgsqELep9" alt=""><figcaption><p>The Reports library shows all saved reports with their source module, filter count, estimated row count, and schedule status.</p></figcaption></figure>

The library has three main areas:

* **Source rail** (left sidebar) — filter the list by module (Donors, Donations, Sponsorships, etc.) or view All, Starred, or Scheduled reports.
* **Template banner** — start from a reusable template with pre-configured columns and filters.
* **Report list** — shows each report's module icon, name, source line, filter count, estimated row count, and schedule status. Use the star to favourite a report. Use the three-dot menu to edit, duplicate, schedule, or delete.
Switch between **Reimagined** (card-style layout) and **Refined** (compact table) using the toggle in the page header.

### Create a Report

Select **New report** to open the report builder.

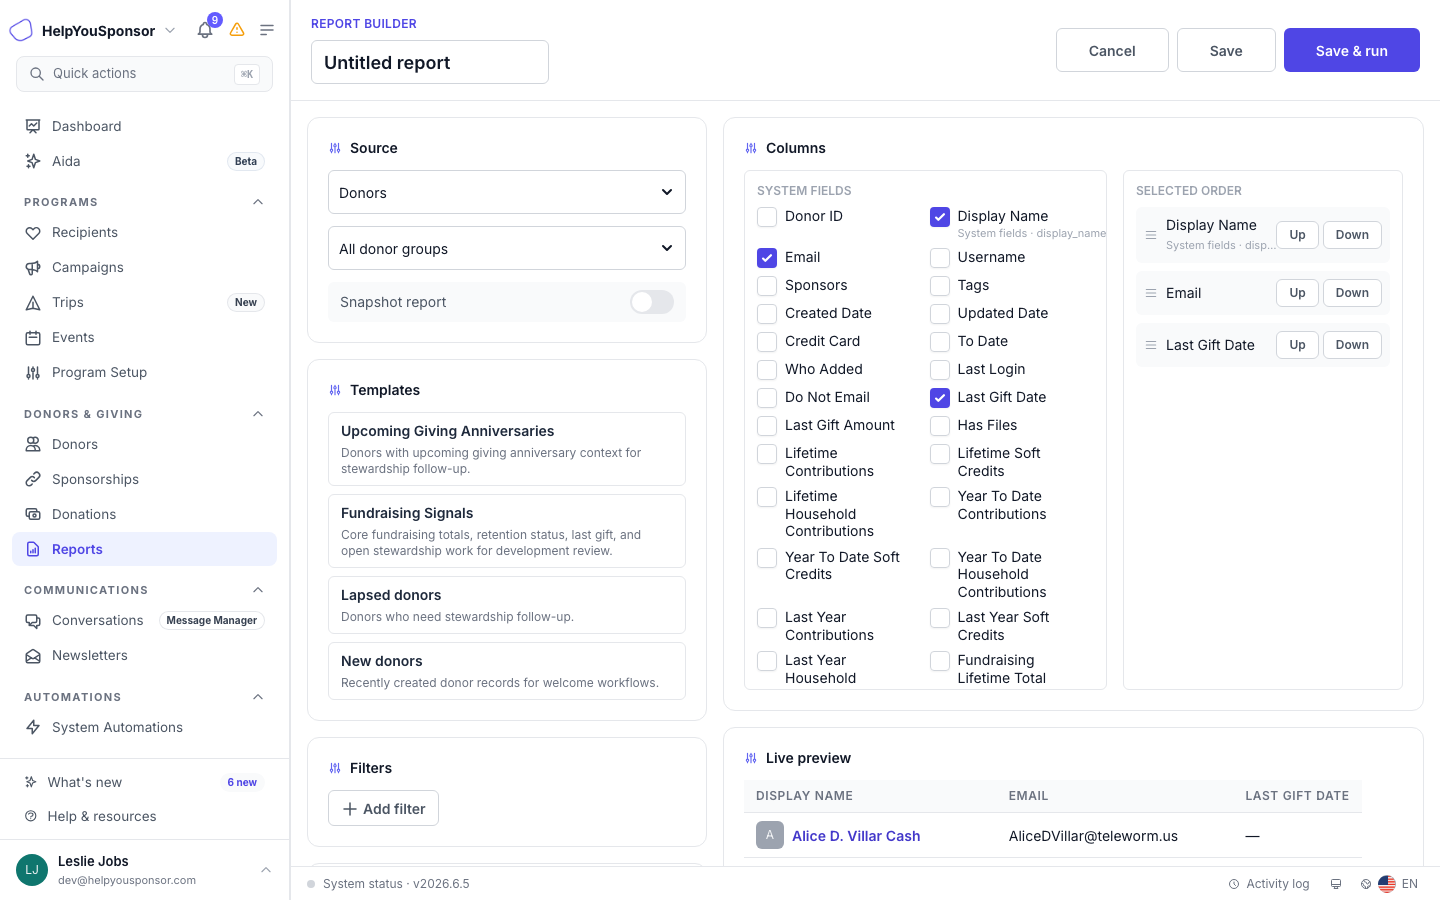
<figure><img src="/files/WM6QrASLxLAg2oxj5q9F" alt=""><figcaption><p>The report builder lets you choose a source module, select columns, add filters, and see a live preview.</p></figcaption></figure>

1. **Source** — choose the data module (Donors, Donations, Sponsorships, Recipients, Campaigns, Events, or Trips) and the form context. Enable **Snapshot** to capture a point-in-time view.
2. **Templates** — apply a pre-built template to quickly set up common columns and filters.
3. **Filters** — add filter conditions with field, operator, and value. Multiple filters can be joined with AND or OR logic.
4. **Sort and range** — choose the sort column and direction. Set a date range for the data (All time, This year, Custom range, etc.).
5. **Columns** — browse available fields grouped by category. Check fields to include them as table columns. Drag to reorder.
6. **Live preview** — see up to eight sample rows as you configure the report.

When you are done, select **Save** or **Save & run**.

### Report Detail Panel

Select a report in the library to open its detail panel.

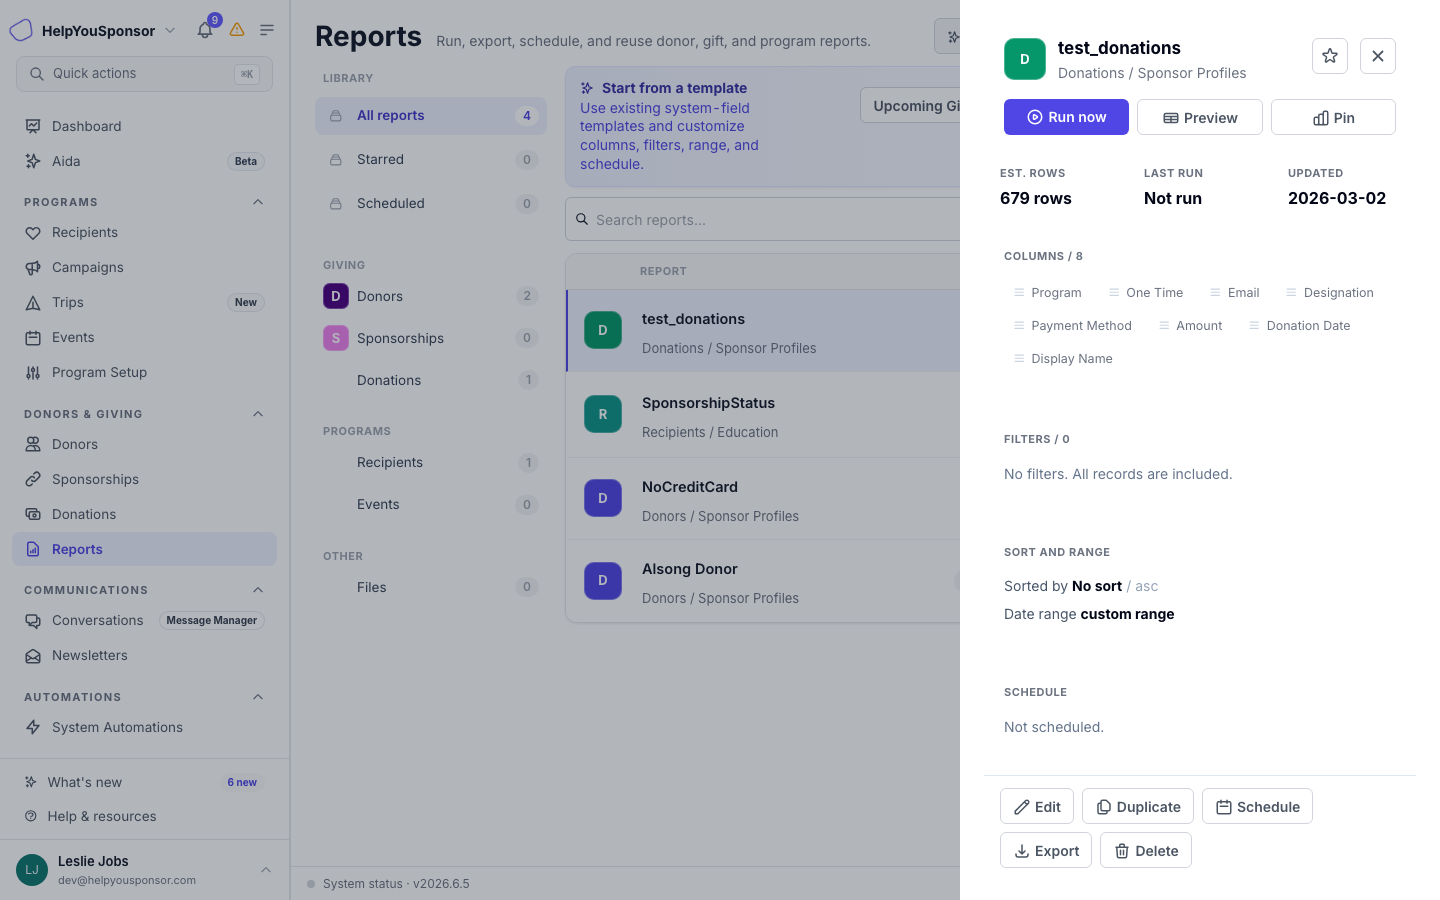
<figure><img src="/files/2bUo3pEyDlNSStNBrZZ1" alt=""><figcaption><p>The detail panel shows the report's columns, filters, sort, date range, and schedule status.</p></figcaption></figure>

The detail panel shows:

* **Stats** — estimated row count, last run date, and last updated date.
* **Columns** — the fields included in the report.
* **Filters** — each filter condition with field, operator, and value.
* **Sort and date range** — the sort column and direction, and the data range.
* **Schedule** — the current schedule frequency and status.

Actions in the detail panel:

* **Run now** — queue a CSV export immediately.
* **Preview** — open the worksheet view to browse the data in-page.
* **Pin** — add a KPI tile to the dashboard.
* **Edit** — return to the builder to change columns or filters.
* **Duplicate** — create a copy of the report.
* **Schedule** — set up recurring delivery by email.
* **Export** — queue a CSV download.
* **Delete** — remove the report.

### Worksheet and Data Export

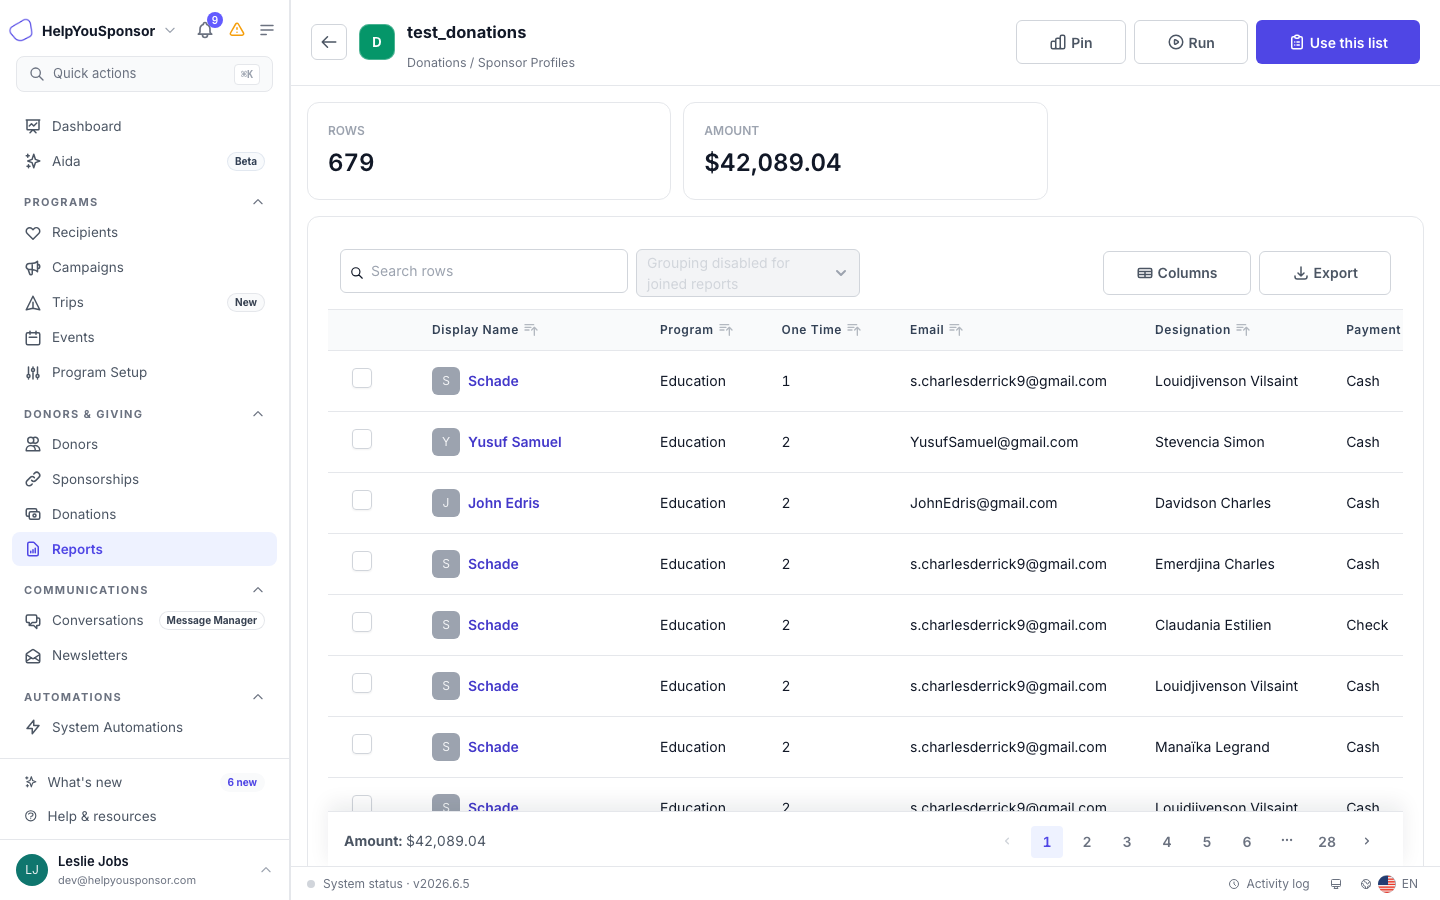
The worksheet view shows the report data in a paginated table.

<figure><img src="/files/gVjwxY3sE5hXHSVjgN66" alt=""><figcaption><p>The worksheet view lets you browse, search, and export report data.</p></figcaption></figure>

* **Search** — search across all columns.
* **Column visibility** — show or hide columns.
* **Pagination** — navigate through pages of results.
* **Export** — select **Export** in the detail panel to queue a CSV download. The progress appears as a banner at the top of the library page. When the export is ready, select **Download**.
* **Audience actions** — use the report's filtered audience for bulk actions (tag, email, SMS, task, journey).

### Dashboard KPI Tiles

Pin a report metric to the dashboard for at-a-glance visibility.

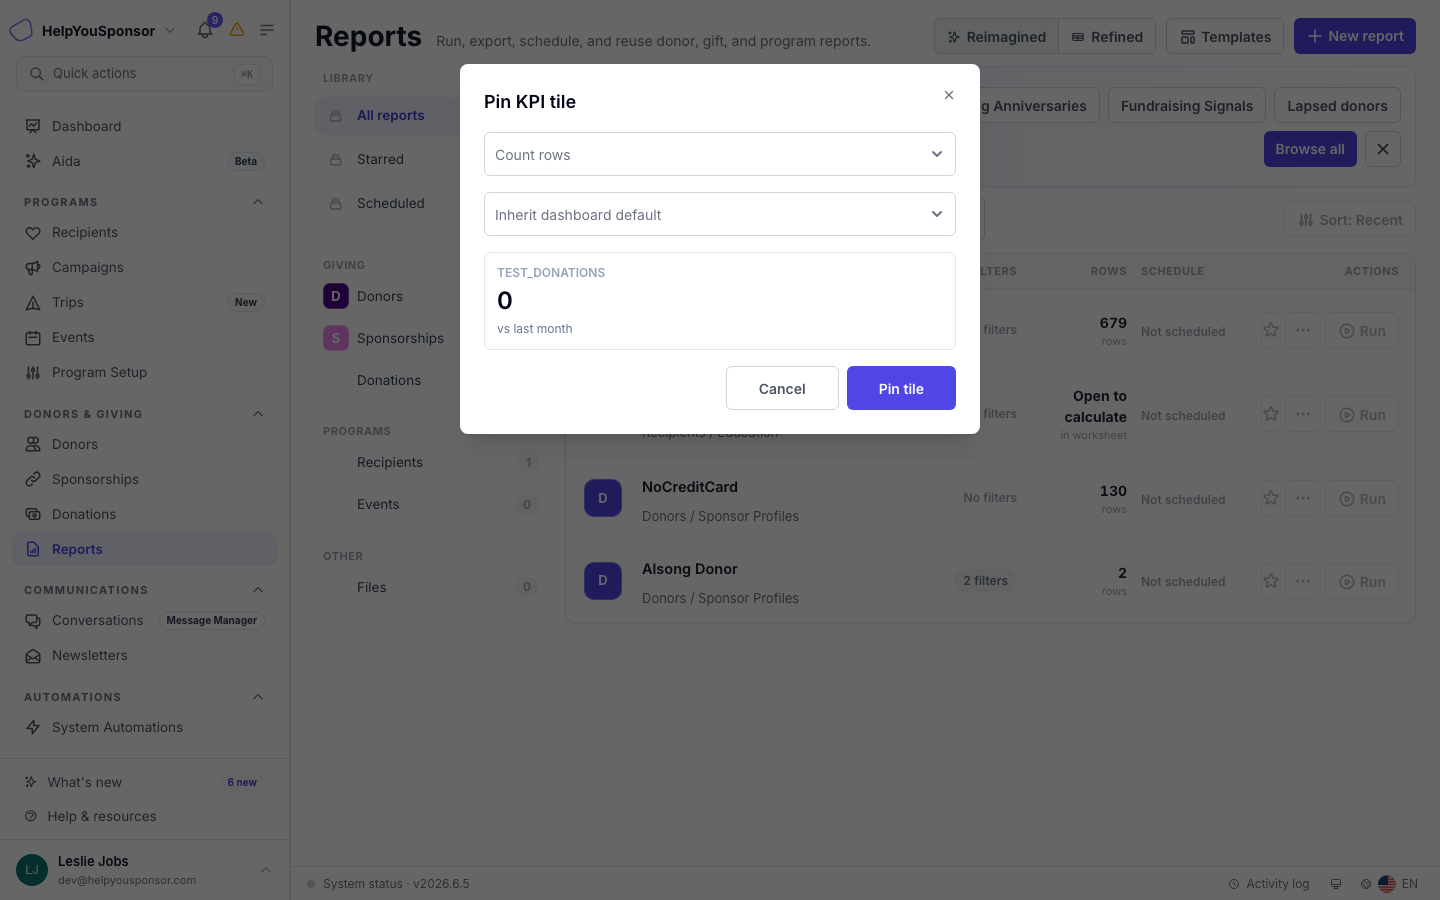
<figure><img src="/files/tUfrpe3qBXWmct2XdEEA" alt=""><figcaption><p>The Pin KPI Tile dialog lets you choose a metric and timeframe.</p></figcaption></figure>

1. Open the report's detail panel and select **Pin**.
2. Choose the **metric** — count rows, or sum or average of a money column.
3. Choose the **timeframe** — the tile can inherit the dashboard default or use a fixed range.
4. Select **Pin tile**.

The tile appears on the dashboard in the key metrics lane. Snapshot reports show a point-in-time value without a timeframe selector.

### Report Templates

Browse pre-built templates from the **Templates** page.

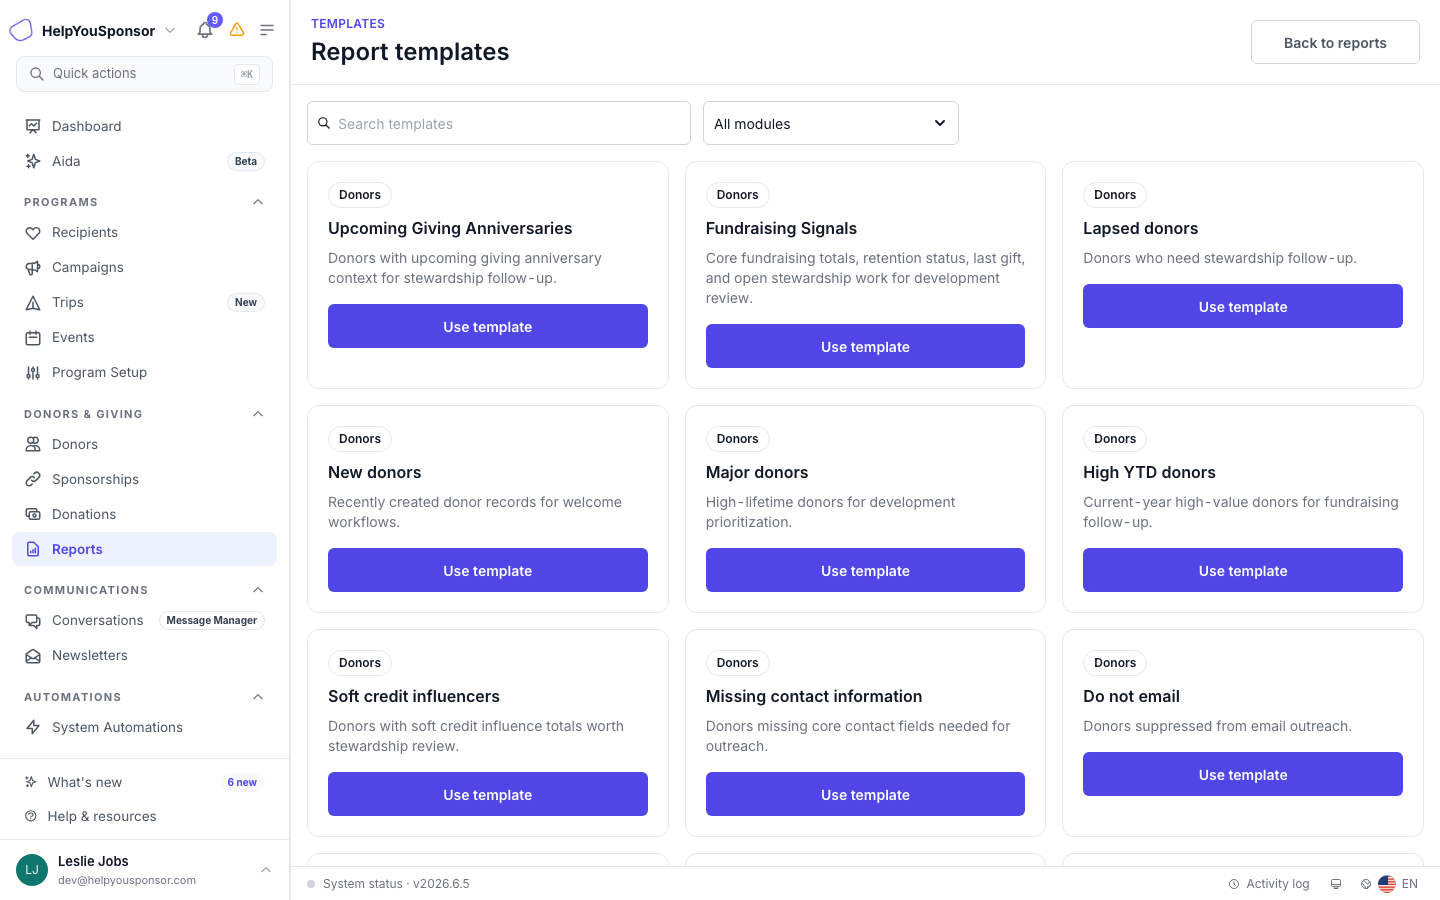
<figure><img src="/files/UNDZ2RtpDnNikHOUj0Lo" alt=""><figcaption><p>The Templates page shows reusable report templates grouped by module.</p></figcaption></figure>

Open the Templates page by selecting **Templates** in the reports library header. Filter by module and search by name or description. Select **Use template** on any template to pre-fill the report builder.

### Permissions

Your role controls whether you can view, create, edit, or delete reports. If the Reports page or the action buttons are missing, your account may not have the reports permission.

***

## Scheduled Reports

Scheduled reports deliver CSV exports by email on a recurring basis. See [Scheduled Reports](/guides/advanced-features/reporting-and-analytics/scheduled-reports.md) for full instructions.

***

## Activity Log

The activity log records every significant action taken on the platform — donor signups, sponsorship changes, payments, messages, file changes, and more.

Open the activity log from the user dropdown menu or the sidebar footer.

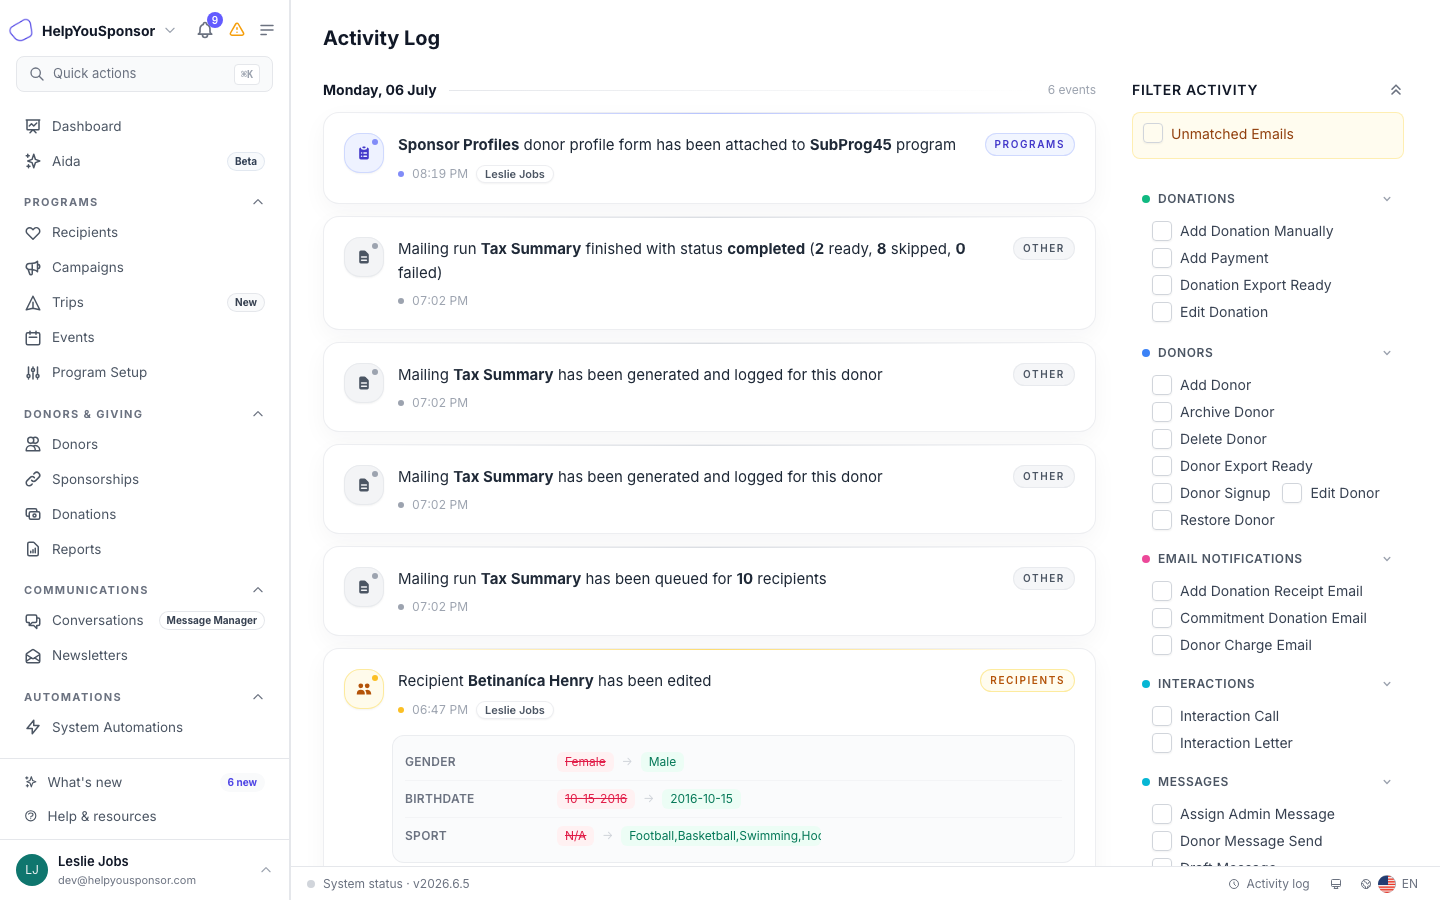
<figure><img src="/files/DByCubl8CXHxj7kjdUqz" alt=""><figcaption><p>The Activity Log groups actions by date with category filters on the right.</p></figcaption></figure>

* **Filter by category** — use the sidebar to show only the action types you care about (Commitments, Messages, Payments, etc.).
* **Filter by action** — expand a category and check specific actions within it.
* **Review changes** — each entry shows what changed, who made the change, and when. For field updates, the old and new values are highlighted.
* **Deleted file history** — file deletion requests appear with their status, request time, completion time, and file manifest.

***

## Dashboard Analytics

The dashboard shows graphical summaries of your organization's transactions and commitments.

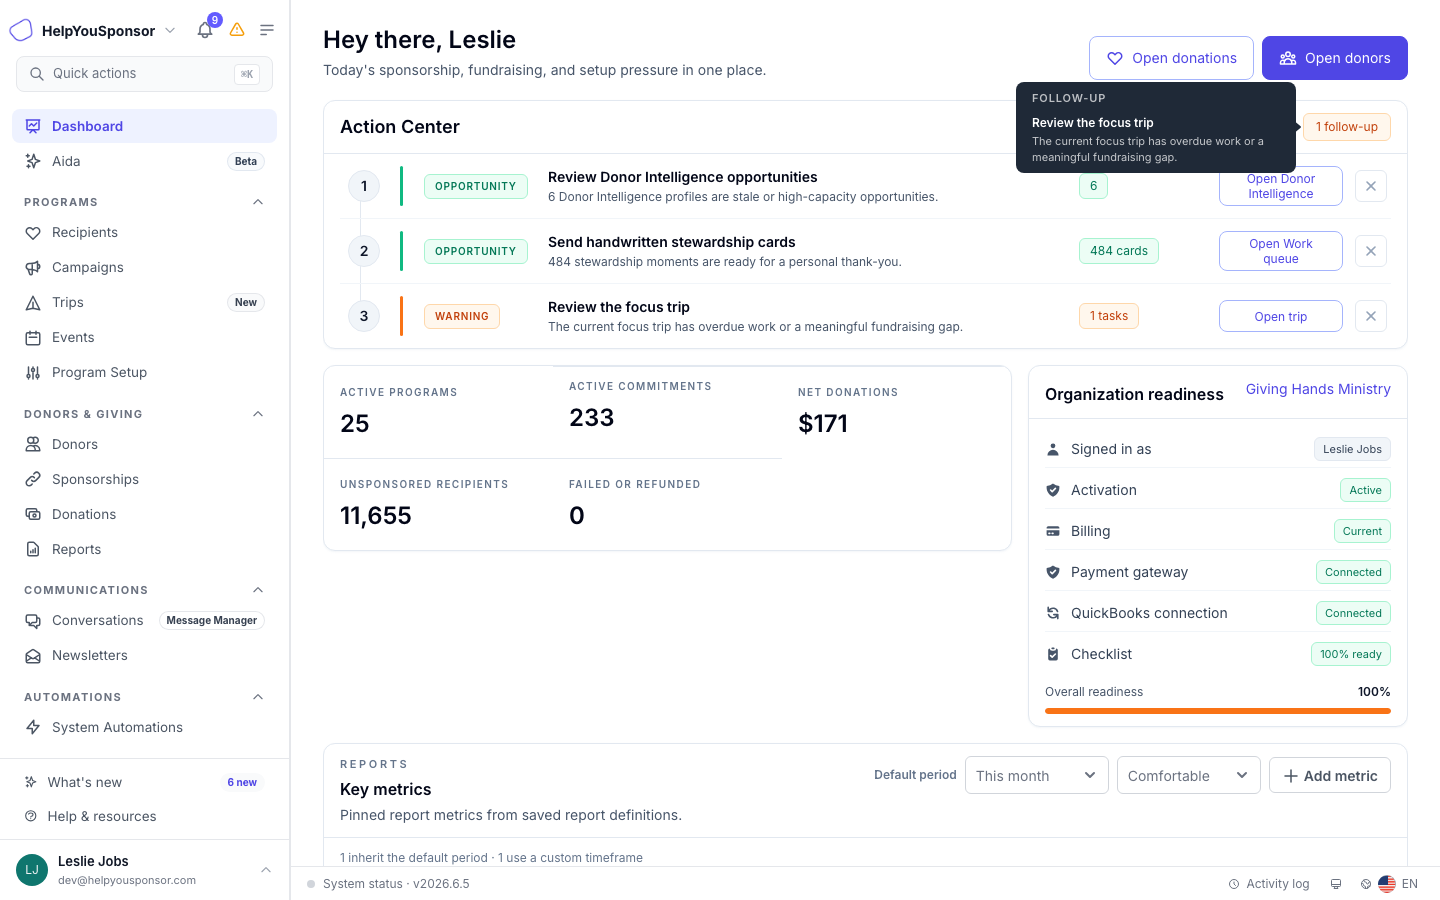
<figure><img src="/files/NEbykclXlZ7MrAbwIVKs" alt=""><figcaption><p>The dashboard shows donation and sponsorship trends with key metric tiles.</p></figcaption></figure>

The dashboard includes:

* **Donation trend chart** — shows donation amounts over time for the latest years.
* **Sponsorship trend chart** — shows sponsorship commitments over time.
* **Key metric tiles** — displays totals and counts for key performance indicators. Tiles pinned from reports appear in this section.
* **Latest statistics** — recent activity summaries.

Open **Dashboard** from the sidebar to view the analytics.

***

## Related Guides

* [Scheduled Reports](/guides/advanced-features/reporting-and-analytics/scheduled-reports.md)